
 insights from industryStefan CairnsProduct Technical Specialist Malvern Panalytical
 Could you introduce yourself and outline your role at Malvern Panalytical?
My name is Stefan Cairns, and I am a product technical specialist at Malvern Panalytical. My core responsibility is to help customers maximize their understanding of macromolecular materials using size exclusion chromatography (SEC).
In this role, I travel throughout Europe, working with everything from rubbers for tires to proteins studied in structural biology labs. I began working with GSEC during my Ph.D. at the University of Edinburgh, before I joined Malvern Panalytical in 2017.
Could you please tell us about the focus area of your recent publication?
Our recent publication, Biophysical Characterization of Viral and Lipid-Based Vectors for Vaccines and Therapeutics with Light Scattering and Calorimetric Techniques, in the scientific journal Vaccines has a broad scope and used a range of analytical instruments from Malvern Panalytical. My contribution to the article, focuses on size exclusion chromatography: both the chromatography itself, along with the detection and the results it produced.
Today, I will be sharing how this technique produces data that allows drug developers to gain a clearer understanding of nucleic acid-based vaccines and therapeutics, focusing on the drug delivery vectors.
What materials were used in your analysis?
We are primarily interested in the use of lipid nanoparticles (LNPs) and viral particles as delivery vectors.
One example of a viral vector is recombinant adeno associated viruses (rAAV), which are composed of a protein capsid material with DNA inside, ranging from 20-30 nm in size. I should note that the rAAV samples that I will discuss are commercial samples, purchased from Virovek. They will normally be noted as full or empty.
The other significant type is our lipid-based nanoparticles, which are a little bit bigger in size, and comprised of cationic lipid, DSPC, PEGylated lipid, cholesterol, and mRNA. The differences between the two types of formulations we will discuss is the ionizable lipid used. The mRNA-LNPs were provided by SINTEF Industry, which is based out of the Department of Biotechnology and Nanomedicine in Trondheim, Norway.
Why were these materials selected for analysis?
These materials hold great promise in terms of their delivery potential. However, they typically pose a significant challenge in manufacturing and analysis due to their intrinsic structural complexity. During development process control, their characterization requires the application of fit-for-purpose, complementary analytical tools. Size exclusion chromatography is one such tool that meets these criteria.

Image Credit:Shutterstock/remotevfx.com
Watch the Webinar Here
What results can the OMNISEC system reveal and what do they tell us about the sample?
The OMNISEC can measure the absolute molecular weight and the concentration of multiple populations (if our sample has been separated into multiple populations). This will give us information about aggregation, oligomeric states, and fragments. Additionly, when you have LNPs you also have a distribution of sizes. The absolute molecular weight is measured at each time point and thus gives us an idea about the distribution of molecular weights present in the sample. That information can tell us about sample stability, the complex molecular weight, and the particle formation quality.
Compositional analysis of the sample is also possible, allowing us to break the sample down into its component parts and measure their concentrations. This individual component part concentration gives us an idea about the drug payloads, i.e., the nucleic acid encapsulation, titer – in terms of both our viral vector and our genome titer – as well as our sample purity. With these two measurements, the user can also determine the % full rAAV.
 Image Credit:Shutterstock/remotevfx.com
How do the detectors in the OMNISEC system give so many different results?
Well the results we are talking about come from the two concentration detectors, and a static light scattering detector, which takes measurements at both 90 and seven degrees.
It is important to examine the concentration detectors first, the intensity of which is in response to the sample concentration. With refractive index, we are examining the different speeds at which light travels through different media. The measurement of the increased refraction is directly linked to the concentration of our sample.
The process is that light shines through the flow cell which at first just contains mobile phase. When the delivery vector is put into solution it changes the refractive index of that solution. So as it elutes from the column and passes through the cell, refraction increases with respect to the concentration of sample.
For UV/Vis, the focus is on measuring the absorption, and – with respect to the extinction coefficient – we can determine the sample concentration in this way. For this system, we are measuring it with a photodiode array and measuring all wavelengths simultaneously (from 198 to 900 nm).
What do you need to know about the sample in order to measure its concentration?
It follows the same basic approach one does when a sample is prepared in multiple concentrations, of which absorbance or refraction is then measured. The K of that slope is measured against the concentration, allowing the concentration of an unknown to be determined.
We simply need to have that slope for the sample in order to measure its . The parameter is different for each the RI and UV/vis detector. The refractive index will be referred to as the dn/dc, and the extinction coefficient at 0.1% is used for the UV absorbance which are the two numbers that we need.
How is information about molecular weight determined by static light scattering?
In this process, a laser is shone on the sample, which absorbs the light, and then remits it in all directions. This is governed by the Rayleigh equation, of which the most important element is the Rθ. Though this is very small, this refers to the amount of light being scattered, which is then proportional to the molecular weight of our sample.
Of course, it is not quite as simple as that; there is additional parameter to the equation that needs to be accounted for. Angular dissymmetry is the name given to the phenomenon whereby the intensity of scattered light can be different depending on the observation angle.
We see angular dissymmetry in the light scattered by larger materials. To account for that, the equation will tell us that we need to measure the ‘zero angle,’ which is not possible. The ‘zero angle’ places our detector right in front of the laser beam, which is far too intense in comparison to the light being scattered. This is a little like trying to count the number of stars when the sun is out: the sun is far too bright, in comparison to the stars, to allow such an action.

Image Credit:Shutterstock/LoveEmployee
How do studies account for angular dissymmetry in larger materials?
To account for this angular dissymmetry, as facilitated by the OMNISEC REVEAL, the light scattering is measured at the seven degree angle (low angle light scattering LALS). For the samples which scatter light unevenly depending on the observation angle, the LALS gets us as close to zero as possible in order to minimize the errors in molecular weight calculations without the need for extrapolation. At this angle the system is measuring the scattering from an entire disc of light. This is performed because, at such an angle, the intensity of noise is significantly increased – so in order to get a good signal-to-noise ratio, the LALS detector measures the entire disc rather than a single point. That provided us with accurate results concerning molecular weight for our large material.
What detector features assist in the analysis of the composition in terms of the population and distribution?
This is largely down to the combination of the separation, concentration determination and identification that makes doing this analysis so helpful. It is very easy for us to perform multiple injections, and we can overlap/overlay two different things. If we consider an example of mRNA-LNP characterization first, we can analyze the refractive index of mRNA-LNP 1 in comparison to mRNA-LNP 2. In the image below, where six different colors represent three injections of each sample, it allows us to get a good, repeatable results and compare the shape of the two elution profiles. The same comparison is made with any of the detectors. 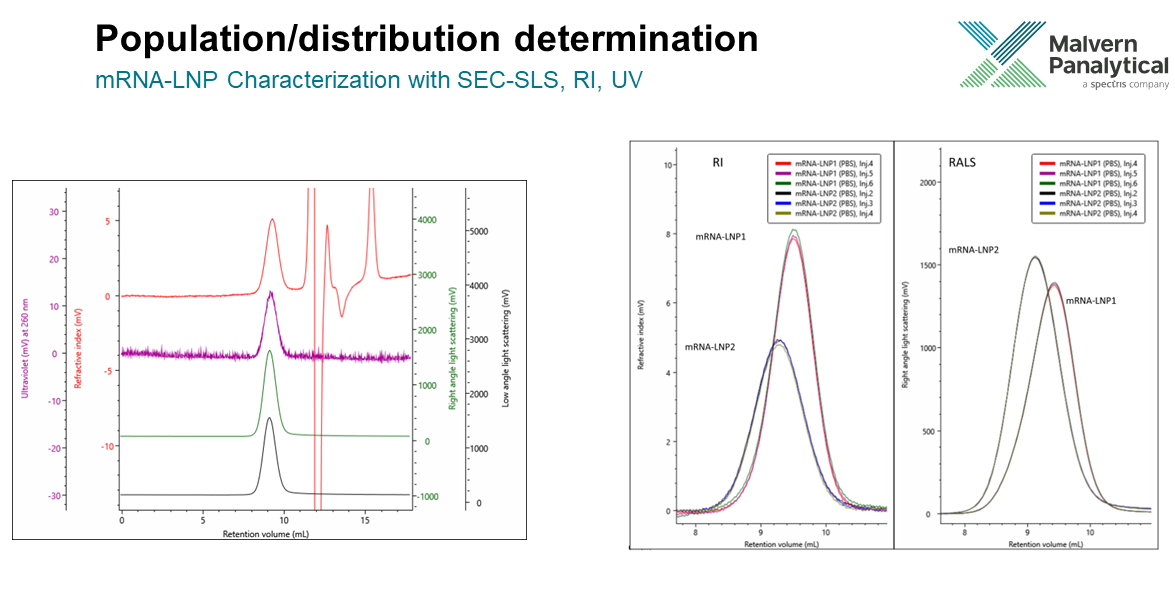
How can these results be presented?
One very useful example is when we plot molecular weight on the Y axis as a function of the retention volume. If we take a look at the example mRNA-LNP below, you see a gradual decline from left to right. It follows that higher molecular weight materials elute first, and then the lower ones. From the graph you see there is not just a single molecular weight present but a range of molecular weights. This already tells us that it’s not perfectly homogenous in terms of its molecular weight.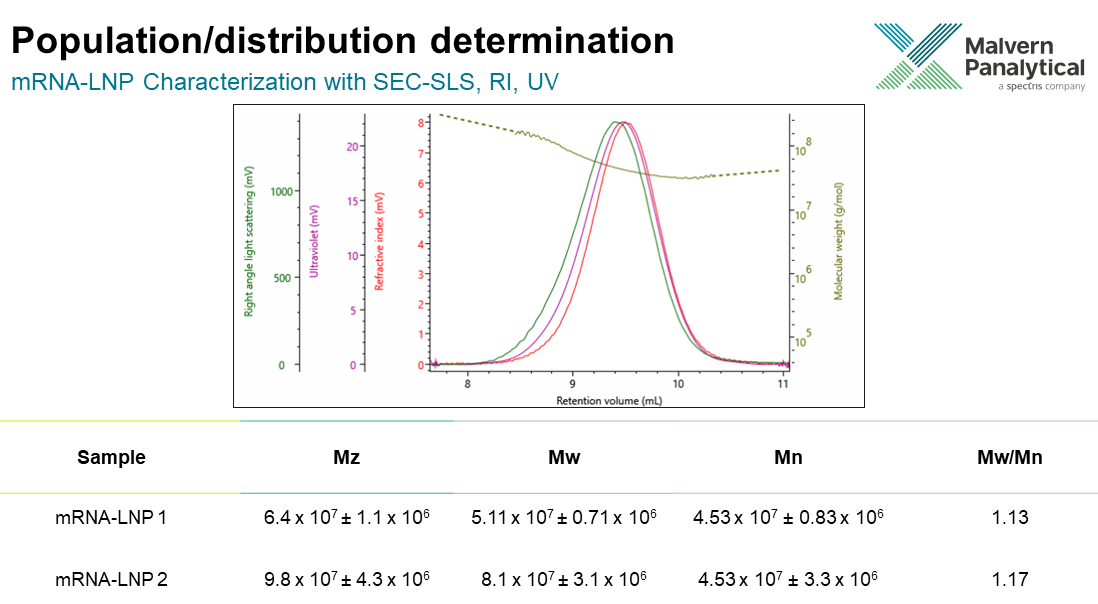
Quantitatively, we can look at distribution from several perspectives, but a good way is to look at the different molecular weight averages. These types of averages may be familiar to anyone who has studied polymer chemistry as an undergraduate level.
Mn is the number average molecular weight, and that’s our statistical mean. Going from right to left, we can then add a weighting towards our molecular weight which gives weight average molecular weight Mw. And we can further and weight that even further to get the z average molecular weight Mz.
These averages help us to quantify the distribution with the whole sample population. The presence of small material is given by the Mn and the presence of large molecular weights from our Mz. The Mn results of the two formulations are similar but the Mw and Mz show us that the mRNA-LNP 2 formulation contains much more bigger material.
In addition to comparing averages, a way to know or calculate the homogeneity is by calculating something known as dispersity (Ð). The dispersity is a comparison of the weight average and the number average molecular weights. Again the wider distribution of mRNA-LNP 2 can be indicated by this result type.
Watch the Webinar Here
How do these results compare to other techniques?
The technique itself is not unique (in comparison to the other products at Malvern Panalytical) in that we can obtain an idea about size and distribution information and population distribution from looking at other techniques at Malvern Panalytical.
I can give you a good example from the rAAV analysis we did in the paper. We can compare the population determination by dynamic light scattering with the Zetasizer Advance series with the OMNISEC system. I am not a dynamic light scattering expert, but I can talk you through some of the results. Considering the AAV 5 full and empty, we see that they are different sizes, it is clear that the empty is larger.
An advantage of this analysis is that the measurement technique of multi-angle dynamic light scattering (MADLS), which is more accurate and precise in comparison to using a single angle like back scattering as calculated using the non-negative least squares fit (NNLS) model. The graph shows us that MADLS gives a narrower mode and so it can give a more defined, accurate size.
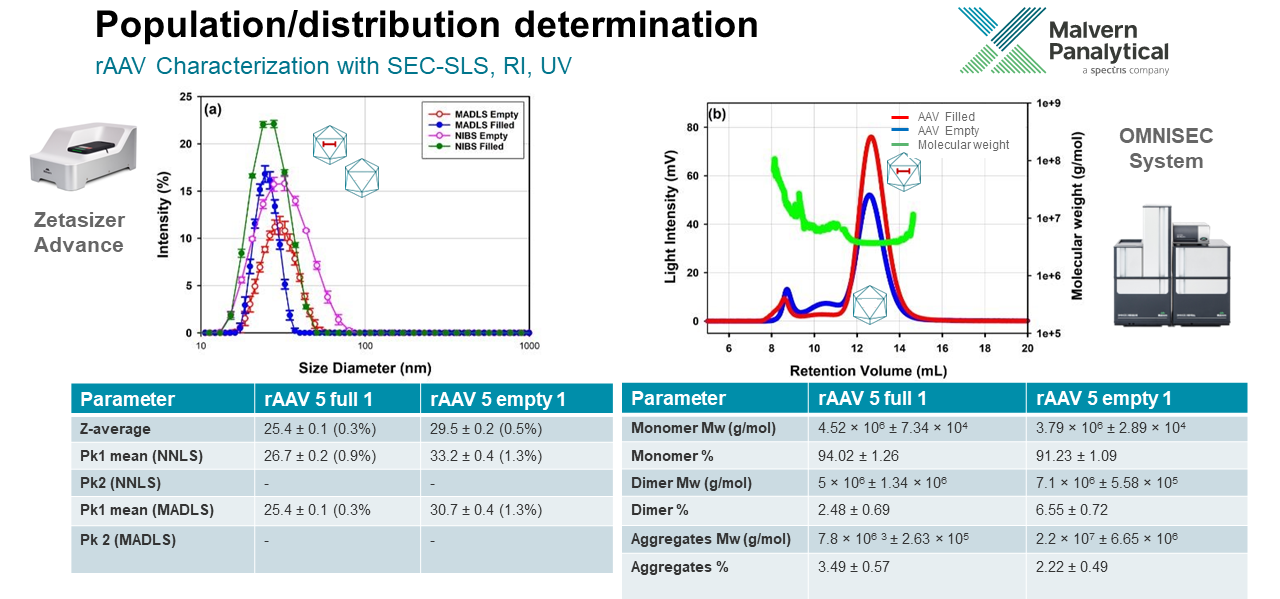
In contrast to that by virtue of doing chromatography, with the OMNISEC system we can break the measurements down into different populations. For example in the SLS chromatograms on the right you can see how the different populations are separated and contrastingly no other discrete populations are identified in the DLS measurement.
The user is also able to characterize each of the individual components in terms of both molecular weight and percentage fraction of the overall sample. This helps to both identify and quantify the monomer versus other oligomers or fragments. Thus making this technique very suitable for comparing batch to batch compositions and stability studies.
 Image Credit:Shutterstock/LoveEmployee
Could you please talk us through the encapsulation determination?
When we are performing multi-detection size exclusion chromatography, the majority of the samples are individual components. We may, for instance, have a protein, a lipid or DNA – but when we have a combination of these, the analysis becomes more complex.
We could have two proteins: we could have protein attached to the DNA; we could have a detergent stabilized protein, or we may even attach a polymer onto our protein. For all of these we can apply compositional analysis, which in turn requires us to use both of the concentration detectors simultaneously, as they are necessary calculate the concentration of each component at each data slice.
It is not overly complicated, at each data slice we have two equations for concentration and we have two unknowns concentrations. They can be then be equated and it outputs the concentration of each component. Once we have determined the concentration of each of our components, we can apply the correct numbers in terms of the dn/dc to determine the molecular weight of the complex and each component in turn.
How are the molecular weights for the vector and nucleic acid obtained?
Concentration measurements allow us to determine the composition. The light scattering then combined with the concentration gives us molecular weight. We primarily consider the UV at 260 nm because we are analyzing nucleic acid, which is dominating the UV absorbance, given that our lipid and capsid nanoparticles are not absorbing, or not absorbing well at this wavelength.
From the information that we feed in, the intensities that we measure allow us to determine the concentration of the nucleic acid as well as the vector.
It is important to note that the absolute molecular weight is independent of the column retention volume and any standards that are being used. Therefore, we can use a completely different standard from our samples to calibrate our detectors and apply it to this analysis. In addition to the results I have already mentioned the software also calculates more specific results. We can also get the capsid and the nucleic acid / genome titer, and the % full AAV.
Could you describe the analysis of the lipid nanoparticles?
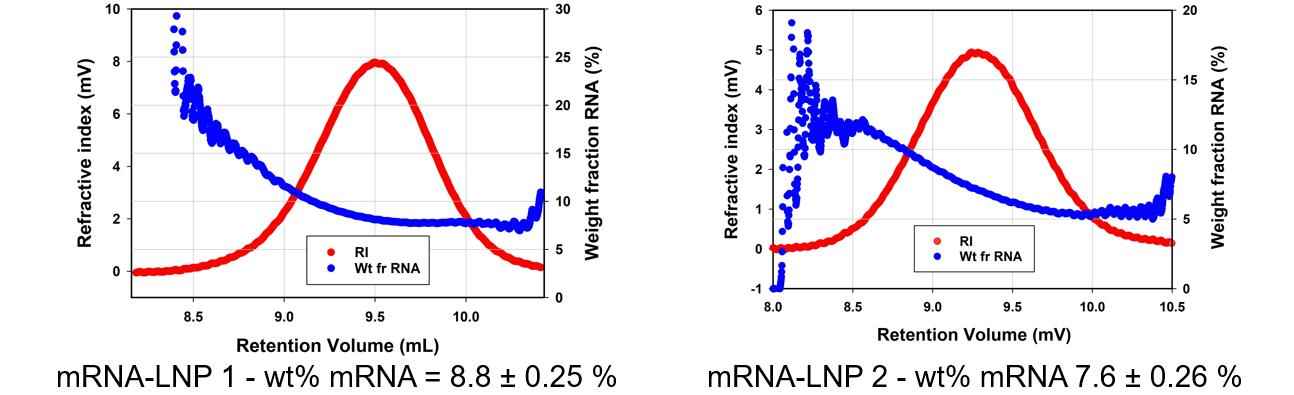
By simplifying the lipid nanoparticle (LNP) down into two different components, for the vector we apply an average dn/dc (which, of course, does not absorb UV light and therefore has a dA/dc of zero) and we apply specific values to mRNA, we can apply compositional analysis. Another difference in these samples is that they are much larger than our other viral sample, which leads the sample scattering light in the UV/vis. We have been developing a way to take this into account with the help of the UV/Vis PDA.
Let's compare our two samples. The mRNA-LNP 1 has a weight percentage of mRNA of 8.8 % and mRNA-LNP 2 was found to be lower at 7.6 %. This result can also be graphed, you can we have put the weight fraction mRNA on the Y axis below. It is interesting to observe that the larger, earlier eluting portions of the sample contain a higher weight fraction of mRNA. This poses the question; are the bigger LNPs within this range more efficient for encapsulating and delivering the payload?
How would you characterize this information, and what can the results of the study tell us about the sample?
In this article, we have primarily considered SEC-SLS measurements. However, the complete study considers a wider range of analytical technology, including:
- dynamic light scattering (DLS)
- multiangle-DLS (MADLS)
- electrophoretic light scattering (ELS)
- nanoparticle tracking analysis (NTA)
- multiple detection SEC
- differential scanning calorimetry (DSC)
Focusing on SEC-SLS measurements, we used this technique to successfully obtain information from our samples: we looked at dispersity, the distribution, and the aggregation profile and saw fragments of our viral sample. Of course, all this information gives us valuable information about sample stability: how it ages, the manufacturing steps, and the product formation quality. We also saw compositional analysis, which gives us a lot of important information on drug loading.
About Malvern Panalytical

Malvern Panalytical provides the materials and biophysical characterization technology and expertise that enable scientists and engineers to understand and control the properties of dispersed systems.
These systems range from proteins and polymers in solution, particle and nanoparticle suspensions and emulsions, through to sprays and aerosols, industrial bulk powders and high concentration slurries.
Used at all stages of research, development and manufacturing, Malvern Panalytical’s materials characterization instruments provide critical information that helps accelerate research and product development, enhance and maintain product quality and optimize process efficiency.
Sponsored Content Policy: News-Medical.net publishes articles and related content that may be derived from sources where we have existing commercial relationships, provided such content adds value to the core editorial ethos of News-Medical.Net which is to educate and inform site visitors interested in medical research, science, medical devices and treatments.
Source: Read Full Article